Control chart is more than a definition. In factory operations, it directly influences how teams detect defects, communicate status, and decide if a product is ready to ship.
When teams standardize Control chart in their daily workflow, teams reduce fragmented workflows and replace manual rework with clear, instant progress updates.
Definition and context
Control charts help teams distinguish normal process variation from signals that require investigation.
They are a core tool for preventing drift before defects escalate into shipment issues.
How control charts work
Data points are plotted against a center line with upper and lower control limits.
Out-of-control patterns such as runs, trends, or limit breaches indicate special causes that require action.
Operational usage
Teams use control charts on critical process and product characteristics to catch instability early.
When signals appear, supervisors can contain risk quickly and investigate root causes before customer impact.
KaizenQ workflow fit
KaizenQ captures inspection data in structured form, making it easier to feed control-chart analysis workflows.
Real-time visibility shortens response time when variation patterns begin to shift.
How this looks in real operations
Imagine an inspection where findings need instant alignment between the factory and the buyer. If Control chart is interpreted differently, shipment gets delayed by a chat mess of questions.
When the same definition is locked into the digital template, everyone aligns on the results immediately, and the shipment moves forward with clear proof.
Where this term fits in the workflow
Control chart is usually shown in the inspection and sampling.
Terms used when teams decide what to inspect, how much to sample, and whether a lot can ship.
What is KaizenQ?
KaizenQ giúp các đội xưởng và văn phòng chuyển $definitions thành workflow sống.
Learn more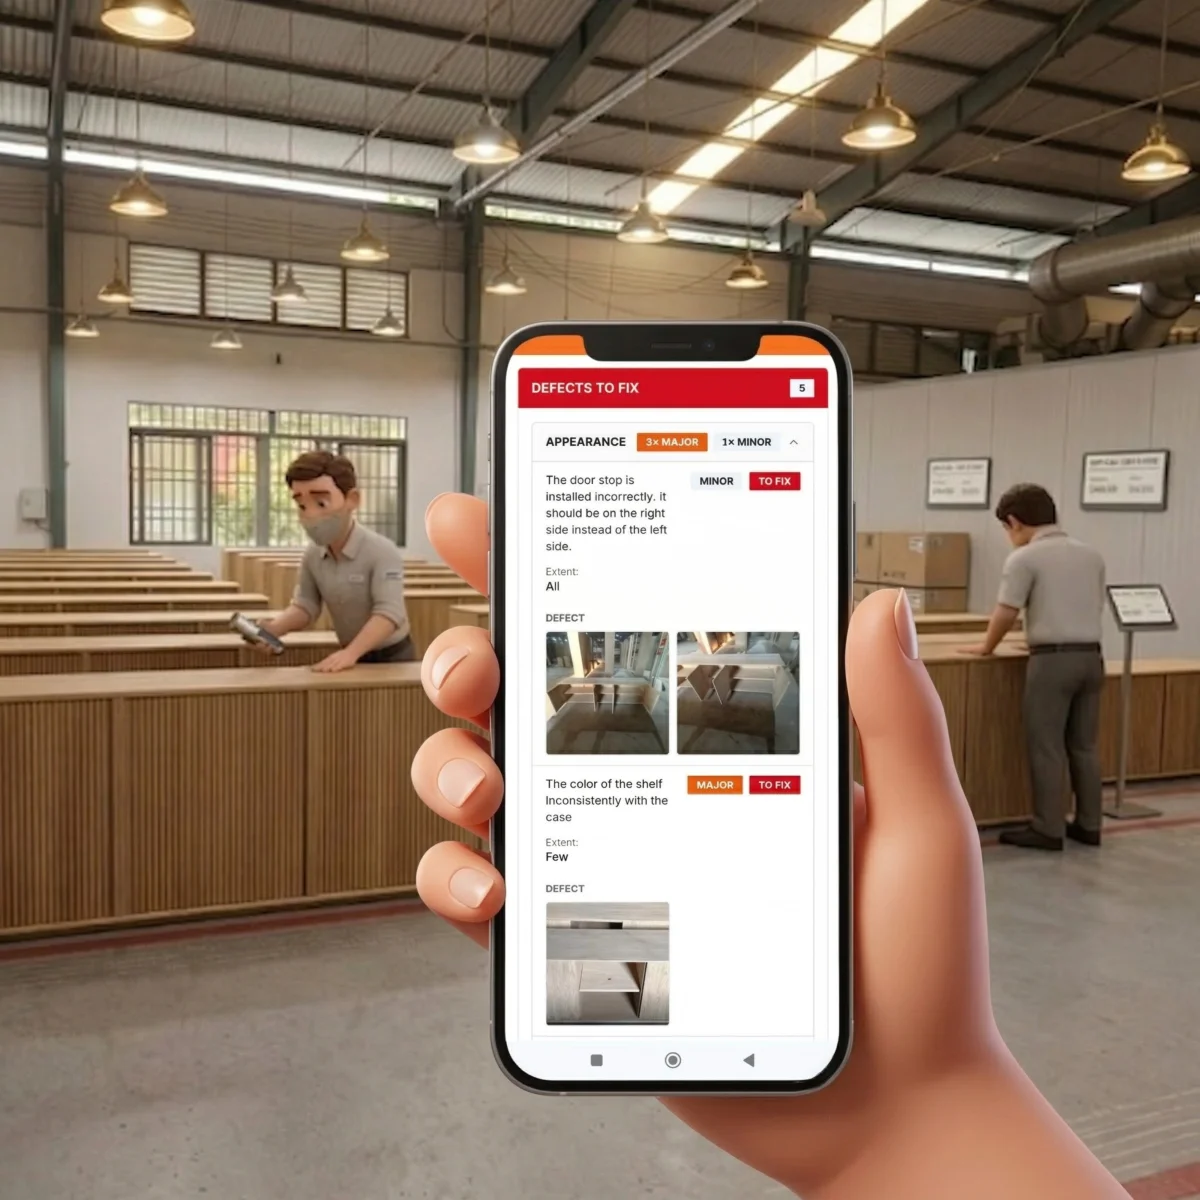
Why this matters
Control chart is critical because production teams need clear results, not verbal hearsay, to make shipment and escalation decisions.
When the office and the factory define Control chart differently, it leads to fragmented workflows, disputes, and delayed approvals.
Replacing chat threads for Control chart with consistent definitions keeps everyone aligned on the same evidence.
How teams implement it
- Embed Control chart directly into your digital inspection templates so it is tracked every time.
- Show your factory team exactly what to verify and capture so the interpretation stays consistent.
- Lock results into a structured inspection history to provide clear proof for managers and buyers.
Common mistakes
- Treating Control chart as a checkbox on a paper form instead of an operational control.
- Using inconsistent definitions causes factory and management to misunderstand each other.
- Failing to capture digital evidence, which leads to manual rework and lost photos in chat apps.
Key takeaways
- Control charts monitor stability, not just conformance.
- Special-cause signals should trigger investigation and containment.
- Fast data flow improves reaction speed and reduces escapes.
Final perspective
Control chart works best when it is built into day-to-day operations, not treated as an abstract concept in a manual.
Frequently Asked Questions
What is Control chart in simple terms?
A statistical chart used to monitor process stability over time and detect unusual variation.
Why does this glossary term matter?
Because Control chart directly affects shipping decisions, quality reporting speed, and team coordination.
How does KaizenQ help with Control chart?
KaizenQ builds Control chart into your digital workflow so your team captures proof once and the office sees it instantly.