

LCL / UCL (Lower and Upper Control Limits) is more than a definition. In factory operations, it directly influences how teams detect defects, communicate status, and decide if a product is ready to ship.
When teams standardize LCL / UCL (Lower and Upper Control Limits) in their daily workflow, teams reduce fragmented workflows and replace manual rework with clear, instant progress updates.
Definition and context
Lower Control Limits (LCL) and Upper Control Limits (UCL) mark the expected range of variation for a stable process. Data points outside the limits prompt investigation before defects proliferate.
Calculating control limits
Control limits are generally set at three standard deviations from the process mean. They differ from specification limits, which are dictated by customer requirements.
Interpreting signals
Patterns such as runs, trends, or cycles inside the control limits can also indicate instability. Teams use statistical rules to determine when to intervene.
Combining control charts with Cpk analysis ensures the process stays both stable and capable.
Visibility within KaizenQ
KaizenQ visualises measurement data over time, highlighting breaches of control limits and automatically notifying stakeholders to contain potential issues.
How this looks in real operations
Imagine an inspection where findings need instant alignment between the factory and the buyer. If LCL / UCL (Lower and Upper Control Limits) is interpreted differently, shipment gets delayed by a chat mess of questions.
When the same definition is locked into the digital template, everyone aligns on the results immediately, and the shipment moves forward with clear proof.
Where this term fits in the workflow
LCL / UCL (Lower and Upper Control Limits) is usually shown in the process control and risk.
Terms that help factories monitor variation, validate capability, and reduce risk before defects escape.
What is KaizenQ?
KaizenQ giúp các đội xưởng và văn phòng chuyển $definitions thành workflow sống.
Learn more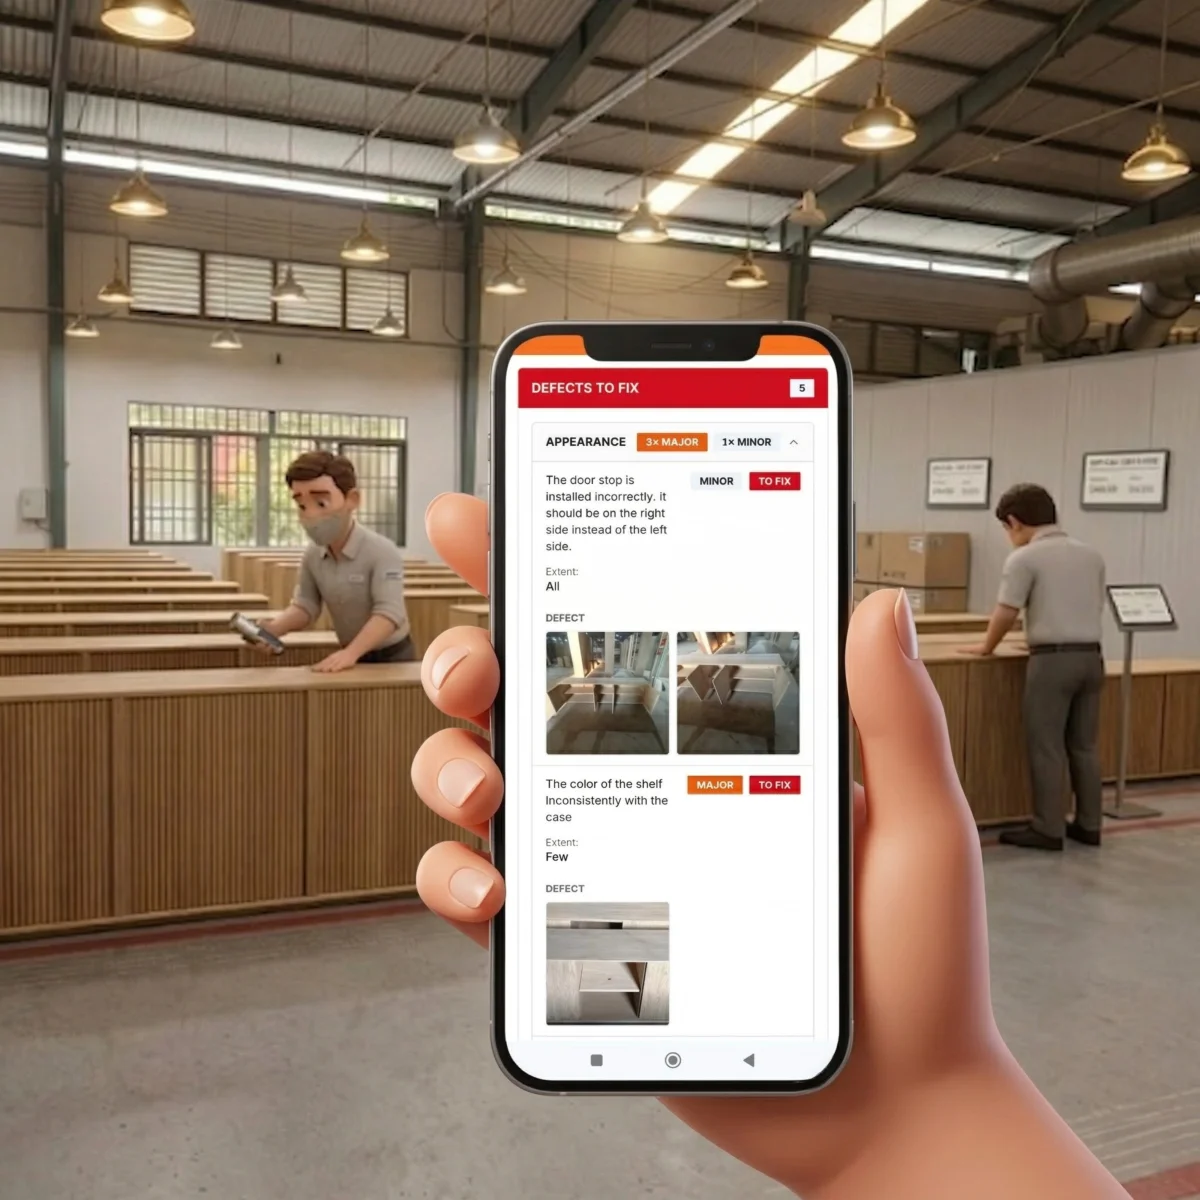
Why this matters
LCL / UCL (Lower and Upper Control Limits) is critical because production teams need clear results, not verbal hearsay, to make shipment and escalation decisions.
When the office and the factory define LCL / UCL (Lower and Upper Control Limits) differently, it leads to fragmented workflows, disputes, and delayed approvals.
Replacing chat threads for LCL / UCL (Lower and Upper Control Limits) with consistent definitions keeps everyone aligned on the same evidence.
How teams implement it
- Embed LCL / UCL (Lower and Upper Control Limits) directly into your digital inspection templates so it is tracked every time.
- Show your factory team exactly what to verify and capture so the interpretation stays consistent.
- Lock results into a structured inspection history to provide clear proof for managers and buyers.
Common mistakes
- Treating LCL / UCL (Lower and Upper Control Limits) as a checkbox on a paper form instead of an operational control.
- Using inconsistent definitions causes factory and management to misunderstand each other.
- Failing to capture digital evidence, which leads to manual rework and lost photos in chat apps.
Key takeaways
- Control limits separate common cause from special cause variation.
- Signals outside the limits warrant immediate investigation.
- KaizenQ alerts teams when data trends point toward instability.
Final perspective
LCL / UCL (Lower and Upper Control Limits) works best when it is built into day-to-day operations, not treated as an abstract concept in a manual.
Frequently Asked Questions
What is LCL / UCL (Lower and Upper Control Limits) in simple terms?
The statistical boundaries on control charts that signal when a process may be shifting out of control.
Why does this glossary term matter?
Because LCL / UCL (Lower and Upper Control Limits) directly affects shipping decisions, quality reporting speed, and team coordination.
How does KaizenQ help with LCL / UCL (Lower and Upper Control Limits)?
KaizenQ builds LCL / UCL (Lower and Upper Control Limits) into your digital workflow so your team captures proof once and the office sees it instantly.